GaryP1958
Active member
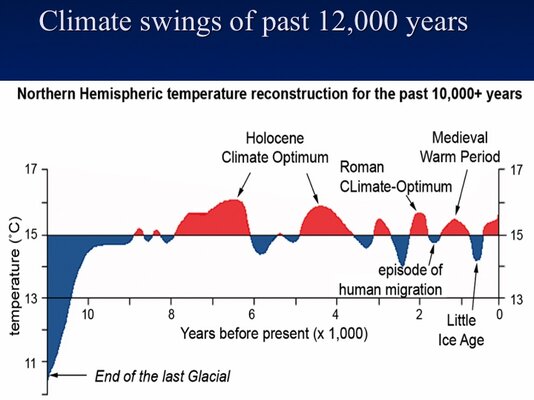
Look at his graph it has a baseline of 60 years not 12000 like the one I posted and at the bottom it is all projected not fact! Al Gore said cities would be flooded by now and AOC said we have 12 years! It was all political to reign in 3rd world countries to slow down development and control of the world! The ice in Antarctica is growing wile the north is shrinking all perfectly normal!